

Discover more from Market Sentiment
2020 congressional insider trading scandal: A stock analysts’ perspective
I analyzed all the controversial trades made by Senators. Here are the results!
Hey everyone, welcome to Market Sentiment. I track and conduct due diligence on rapidly growing stocks and do a comprehensive deep dive on one investment strategy/topic every week.
If you find this post valuable, check out some of my other posts:
To receive this newsletter in your inbox weekly, consider subscribing
The ability of Congress Members to trade stocks has been controversial from the start. There have been multiple stories covering the 2020 congressional insider trading scandal where Congress Members allegedly used insider knowledge to trade large positions in stocks just before the coronavirus pandemic crash. But none of the articles talked about the financial implications of those trades and whether the retail investors could have front-run the market using the disclosed data. Basically, what I wanted to know was
How much did the Senators save by offloading their positions before the crash and could I have done the same?
Where is the data from: efdsearch.senate.gov
For my previous analysis into congressional trading, I used data from senatestockwatcher.com. But not all the transactions are captured on the website and I wanted to match exactly with the trades reported by famous journals. efdsearch.senate.gov is the United States official website where Senator, former Senator, and candidate financial disclosure reports are available. Some of the data is available as a scanned file and some in normal HTML format. I had to manually transcribe most of the data used in this analysis.
In case you are wondering about the time delay between the actual transaction and reporting, Congress Members are expected to report the transaction within 30 days. The median delay in reporting that I observed for all the trades was 28 days.
All the trades and my analysis are shared as a google sheet at the end.
Analysis:
There are multiple factors at play here.
Timeline: On January 24, 2020, the Senate Committees on Health and Foreign Relations held a closed meeting with only Senators present to brief them about the COVID-19 outbreak and how it would affect the United States. I am considering this as the start time for my analysis. Any sale made by the senators after this point up to Feb 26 is considered. (I did not consider sales beyond that point as SPY dropped 8% during that week. My assumption here is it’s realistic for any person be it a normal investor or a Senator to panic sell after seeing that drop). For reference, SPY dropped an additional 25% over the next 3 weeks!
Senators under consideration: I have considered trades done by 4 senators in my analysis. I have focused on these 4 as all of them were investigated by Justice Department and the FBI following the trading scandal.
Richard Burr
Kelly Loeffler
James M Inhofe
David A Perdue
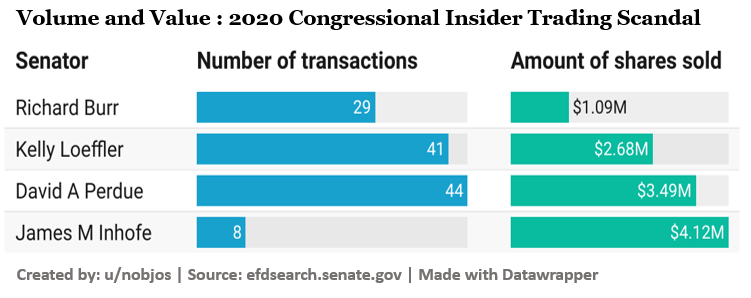
David Perdue sold 44 times ($3.49 MM) in the 33 days following the closed senate meeting. Interestingly James Inhofe only transacted 8 times but the combined value of shares he sold was a whopping $4.12MM. The most ironic part is that Richard Burr who was under investigation the longest and had to step down from the intelligence committee due to the scandal had the least dollar volume in the transaction ($1.1MM).
Results:
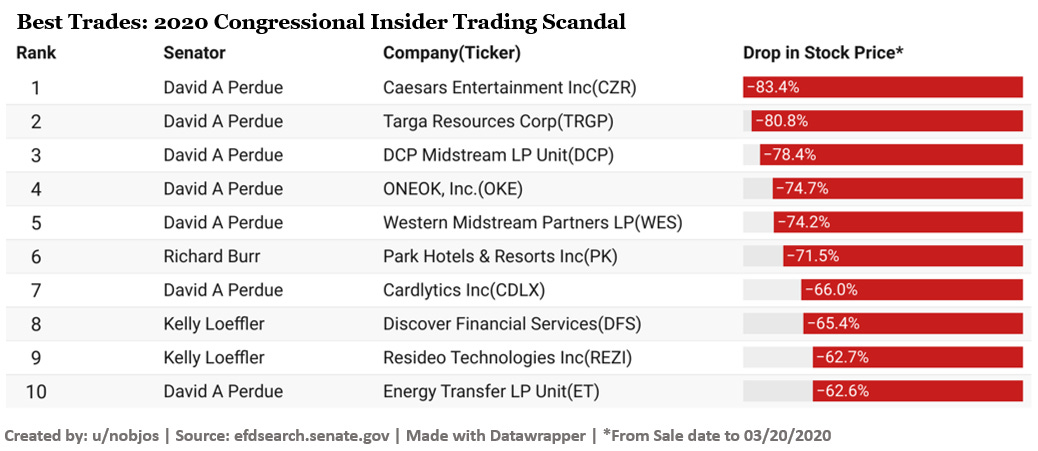
Before we dive into the overall amount saved by the Senators and the retail investor side of the analysis, let’s see what were the best trades made by the Senators during that time period.
David Perdue absolutely killed it with his stock plays. He is present 7 times in the top 10 list and his best play, Caesars Entertainment reduced 83% after he sold his position. Fun Fact: if a stock reduces 83%, it has to go up 488% just to reach back to its initial price. Another interesting observation from the chart is that senators mainly sold stocks related to the entertainment and hospitality industries which were the most severely affected industries due to the pandemic.
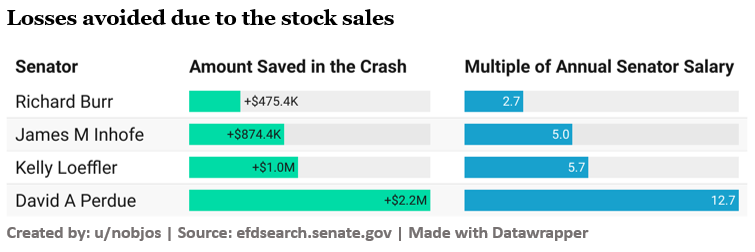
The above chart showcases the amount of money saved by the Senators due to front running the market crash. David Perdue saved an insane $2.2MM with his stock sales. I also kept a multiple of annual Senate salary to showcase the scale of impact they made to their portfolio because of the trades.
Finally, we come to the million-dollar question. Was it possible for the retail investors to follow these trades and front-run the crash?
This is where the analysis gets a bit tricky. 88% of the transactions were reported by March 3rd but if you consider it in dollar values, only 52% of the transactions were reported (some of the high-value transactions were reported only after the crash). But if you were an astute investor, you could have observed a stark difference in what the Senators were saying and how they were trading. For Eg. Richard Burr reassured the public that the US was well prepared for the pandemic but then sold $1MM worth of stocks in the next two weeks. I know that hindsight is 20/20 but if you could have connected these two dots, then you could have saved up to 25% of your portfolio before the crash.
Limitations of analysis: There are some limitations to the analysis.
a. I have only used one black swan event for the analysis. A better method would be to analyze the stock trading pattern over 3-4 major crashes and see if any pattern emerges. But the current limitation is that efdsearch.senate.gov has only data since 2012.
b. There is no disclosure for the exact amount of money invested by Congress Members. The disclosure is always in ranges (e.g., $100k – $200k). So, for calculating the transaction amount, I have taken the average of the given range.
Conclusion
I intentionally left out the party affiliation of the Senators as I did not want our political views clouding our financial judgment. I could not find a single example where a retail investor or an institutional investor or even a hedge fund leveraging this information to make their trades (it might just not be public!). Another possible explanation here is that Senators might just have superior stock trading capability as none of them were indicted for this and all investigations are closed now.
However you view it, this analysis in addition to my last analysis (which proves that Congress Members have better returns than SP500) showcases that there is significant money to be made by following their trades closely!
Google Sheet containing all the data: here
Disclaimer: I am not a financial advisor.
Hope you enjoyed this week’s issue! If you found this insightful and think more people should be aware of this, please share it with them!
PS: Let me know what you think. I read and reply to every response :)






Thank you so much! I absolutely love the way you present the data! I cannot imagine how long it takes for you to go through all of it first and then present in a way that is very easy to read. So impressive!!
Really interesting analysis! As a budding data scientist this seems like a fun project to tackle. Are there data you used that is not publicly available?