

Discover more from Market Sentiment
Let’s be real here. We all have bought into an IPO that we regretted. We might have been swayed by the Red Herring report, the marketing pitch, or the investment banks' roadshow. I personally have lost money in both the IPOs that I bought into and now avoid IPOs like the plague. However, I wanted to keep my personal experience out of the analysis and wanted to understand
Whether IPOs in general make or lose money for the average investor?
Where is the data from: iposcoop.com
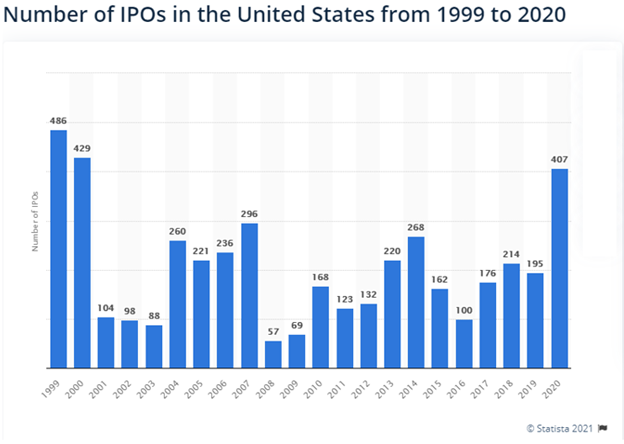
This is the first time in any of the analyses that I have done where the data was accessible directly in a usable format. They have documented almost all of the IPOs from 2000. I have cross verified the data with Statista and have observed coverage of more than 90%. This period covers a wide variety of situations such as the dot-com crash, 2008 financial crisis, market rally following the crisis, etc. which implies that our analysis covers both bear and bull market.,
All the IPOs and my analysis have been shared on a Google sheet at the end.
Analysis
Before we jump into the analysis, there are some things we need to understand about IPOs (if you know the inner workings of an IPO, please feel free to skip to the results). When a company wants to go public, they hire investment bankers to sell the shares. The investment banks are then responsible for creating interest, choosing the optimum time to go public, and make sure the price is right so that there is enough demand. But the banks offer a large share of the allocated stock to institutional investors such as pensions, endowments, or hedge funds. Retail brokerages can end up getting shares, but they may make up only 10% of the total allotment.
Adding to this, additional factors such as your brokerage account, account balance, the historical trading pattern will all contribute to whether you get the IPO shares or not. (i.e., Brokerages tend to allocate IPO shares to their premium clients). For e.g., in the case of TD Ameritrade, your account must have a value of at least $250,000 or have completed 30 trades in the last 3 months.
I have factored in the above limitations and have calculated the historical performance of the IPOs in two different ways
a. You get the IPO allocated at the offer price (the price at which institutional investors are buying)
b. You buy the IPO when the market opens on the listing day (opening price)
For the above scenarios, I have analyzed the following
i. Listing Change (Difference between Opening price and Offer price)
ii. One day change - inclusive of listing
iii. One day change - exclusive of listing
To make it simple, let’s take the example of company X. If the offer price of the IPO is $10, the Opening price on the day of the IPO is $12 and the Closing price is $15 then,
· Listing change is +20%
· One day change inclusive of the listing is +50%
· One day change exclusive of the listing is +25%
Results
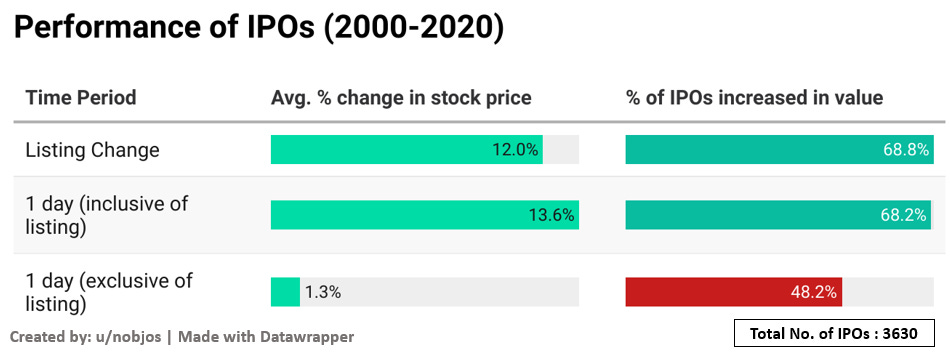
On average, IPOs did make money for the investor. But the amount is significantly different if you got allocated the IPO at offer price vs you bought the IPO at market open. The average listing change over the last two decades was 12% and the average one-day gain in the market inclusive of the listing was 13.6%. Adding to this more than 68% of the IPOs ended in green on the listing day.
But the story is markedly different if you choose to buy at the market open. Only 48% of the IPOs ended at a price higher than the opening price and the average change was a mere 1.3%. Now that it’s out of the way, diving deeper into the data brings interesting insights.
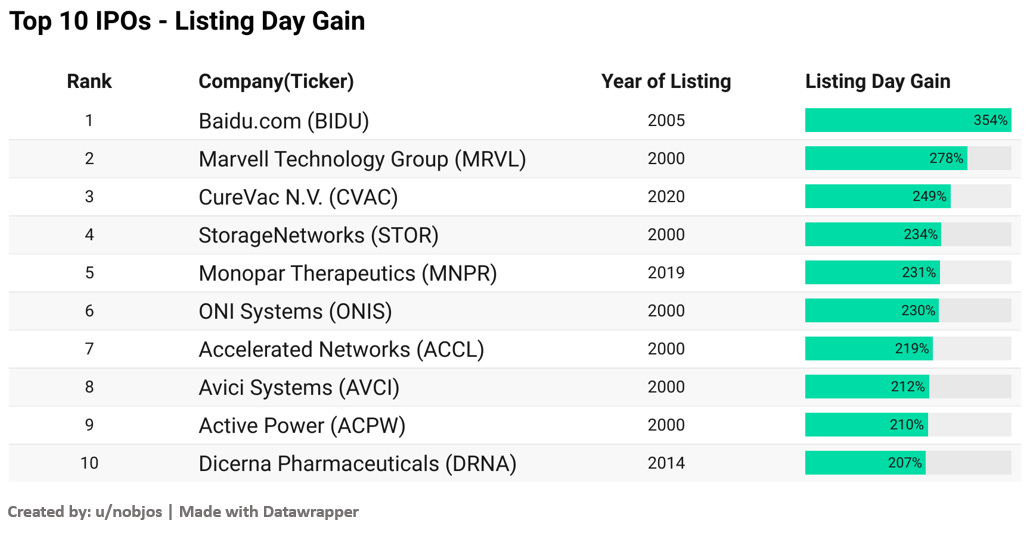
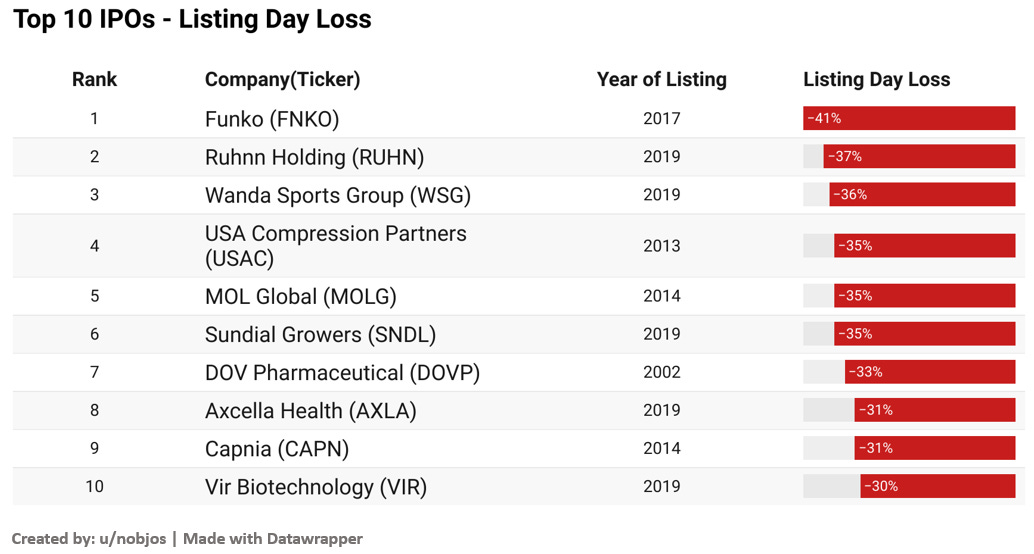
Above is the list of top 10 IPOs having the most amount of gain on listing day. Baidu.com made a whopping 354% on its listing day. Another interesting observation is 6 out of 10 companies in the list were listed in 2000 and were predominantly tech companies (just before the dot com crash). But not all companies had a great experience on the IPO day. Here is a list of the worse performing companies on the day of listing.
There are certainly some familiar names on the list. Funko IPO is considered to have the worst first-day return for an IPO in the last two decades. Sundial Growers also had a rough time in the market on its listing day with the stock losing 35% of the value in one day.
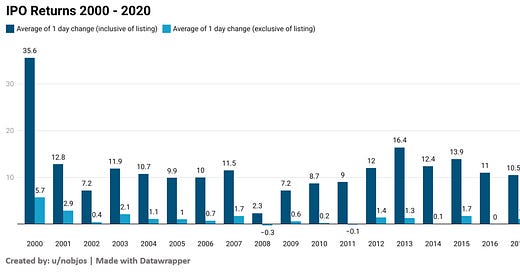
I also calculated the IPO returns for each year after 2000. As expected, the year 2000 was the most successful year for an IPO with an average return (inclusive of listing gain) of 35%. The worst year was 2008 (after the financial crisis) with only a 2.3% return. This graph also showcases two important things
a. On average the IPOs have made positive returns every year in the last two decades
b. There is a vast difference in your returns based on if you got the stock at offer price vs opening price and the trend holds across the years.
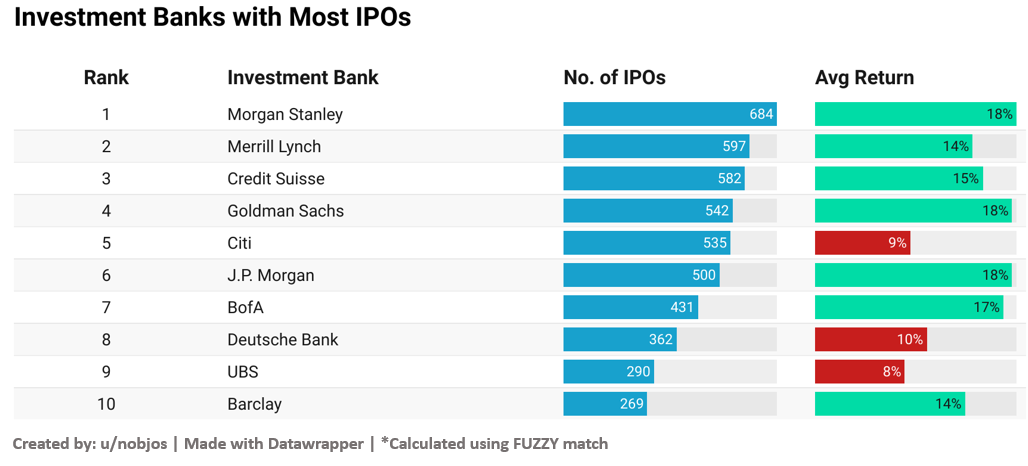
This brings us to our final question of which investment bank made the most number of IPOs and how was their performance on listing day
Out of the top 10 list, only 3 Investment banks had below-average returns. We are not going to draw any conclusion from this as an IPO is usually handled by multiple banks in partnership and the above analysis is done using Fuzzy match (its an approximate match)
Limitations of the Analysis
There are some limitations to the analysis.
a. We don’t have 100% coverage for the IPOs done since 2000. From comparing to other sources, I could observe more than 90% coverage and I feel that this should be representative of the whole.
b. There is no data showcasing what percentage of each IPO was offered to the retail investor.
Conclusion: I have some theories to explain the IPO performance. I think it’s driven mainly by two factors. One being the hype/PR generated by the investment bank about the company and the second is that I think the investment banks slightly price the IPO lower than the market value of the company so that the IPO issue is 100% subscribed (their fees are dependent on a successful IPO). Both these factors contribute to the listing as well as the one-day gain that we see across the board.
Overall, this once again seems to a situation where having money makes you more money (institutional investors having easier access to the IPO) but as the analysis shows retail investors can still make significant gains by buying into an IPO!
Google Sheet containing all the data: here
Hope you enjoyed this week’s issue! If you found this insightful and think more people should be aware of this, please share it with them!
Disclaimer: I am not a financial advisor. If you are planning to invest in an IPO, make sure your brokerage support purchasing IPOs, minimum criteria to participate, and also the historical track record of your brokerage in issuing IPOs. All of this will significantly improve your chances of getting the IPO issued at the offer price.
Hey everyone, welcome to Market Sentiment. I track and conduct due diligence on rapidly growing stocks and do a comprehensive deep dive on one investment strategy/topic every week.
If you liked this post, you should give a shot at:
To receive this newsletter in your inbox weekly, consider subscribing




Loved this analysis. Confirmed what I thought was the case. IPO's are great if you are an insider, not so much for the rest of us. Big surprise, huh?
Really appreciate the effort you put in these reports. Just wanted to say thank you and that I throughly enjoy them!