

Discover more from Market Sentiment
Hello friends! Welcome to Market Sentiment. Join 12,623 other smart investors and traders by subscribing here:
You can check out my other articles here and follow me on Twitter too!
This issue of Market Sentiment is brought to you by… Rows
It’s your choice (and bet!) how to invest your capital - stock, cryptos, NFTs, the Metaverse. But one thing you’ll need for sure – a reliable spreadsheet for your portfolio.
Rows has reinvented spreadsheets to work the way you need.
All the data on stock, crypto, and more - even the ones normally living behind paywalls - is now available right in your spreadsheet. Instantly connect any of 40+ integrations with services like Stripe, Google Analytics, Twitter, Salesforce, public databases like Crunchbase, LinkedIn, or custom APIs.
With Rows you can build interactive dashboards, automated reports, forms, or models that will look and work great on any device. All without code.
On a more personal note, I have used Rows for some of my most data-heavy analyses such as the Jim Cramer tracker, Sustainable investment strategy, Congress trading, etc. Their finance integration with Alpha Vantage is one of the best I have used. Do check them out.
I have a confession to make. Even after all the analyses and strategies I have created, I allocate most of my investments to the S&P500 while keeping some part of it for the moonshots. I have told the exact same thing to everyone who has asked me personally for investment advice.
But as explained in this fantastic article by Nick, the problem with most financial advice is that it’s biased heavily towards your experience. I started investing in 2017 and have experienced nothing but a bull market (albeit the brief Covid-19 dip). But consider the situation of someone who started investing in 2000 or in the peak of the 2007 bubble. In both cases, it would have taken more than 6-7 years just to break even on their investments. I can’t even imagine waiting more than half a decade just for my investment to grow to its initial value, given the current market conditions.
Given that there is no one size fits all approach in the stock market, in this week’s analysis, I am doing a deep-dive into the various types of investment strategies, the returns generated, and their limitations.
I should warn you now that this is not about finding the strategy that gives you the most returns. This is more so about finding what type of investment strategy fits you the best. While putting all your portfolio into crypto might end up giving you a 10,000% return (which is fully viable for a 20-something-year-old with a small portfolio), having an 80% drawdown is not something a 50-year-old with a retirement account would be looking forward to.
The point I am trying to make here is that investing isn’t an absolute game, it’s a relative game. What fits you perfectly might be terrible for others. Your risk tolerance might be way higher. So I am offering you a choice:
You take the blue pill, the story ends, you can close the page now and believe that DCAing into S&P 500 is your best bet. You take the red pill, you stay in wonderland, and I show you how deep the rabbit-hole goes.
Let’s start with the various types of investing strategies that are out there. Granted, this is not a conclusive list of the various types of investments, but I have tried to cover the popular strategies that are out there.
Before we jump into the results, now would be the right time to explain some concepts relating to how to analyze your investments objectively.
a. Cumulative Return: It’s the total return you would have made on your invested amount. Let’s say you invested $100 and over the next two years the investment went up to $200. Then the cumulative return is 100%.
b. Rate of Return (aka annualized return): It’s the measure of how much your investment has grown or shrunk in an annualized format. This allows us to compare investments that are active across different time periods.
b. Sharpe Ratio: Sharpe ratio measures your investment return while making an adjustment for risk. For example, two investors A & B generate a return of 15% and 12% respectively. However, if A took much larger risks when compared to B, it may be that B has a better risk-adjusted return. All else equal, the higher the Sharpe Ratio, the better is your investment.
c. Max Drawdown: This is the maximum observed loss from a peak to a subsequent bottom of the portfolio. It is an indicator of the downside risk over a specified time period. A 30% max drawdown implies that your portfolio was down 30% from its all-time high at some point during your investment period.
A quick note on how the investments are made: I am considering an equal amount invested monthly into every strategy (Since this is the most realistic way of investing for a large majority of investors and lump-sum investing returns are heavily influenced by the starting point)1.
SPY and Chill
I feel that this is one of the most common types of investment out there with a person investing an equal amount into SPY every month and holding on for a long time. The basic principle behind this strategy is that the stock market as a whole will keep rising over the long period as the national economy grows. Wealth creation would be possible by just tagging along with the index rather than trying to pick and choose winners within the stock market.
As expected, just investing in SPY gave an excellent annual return of 12.3% over the last two decades. On the flip side, since your portfolio is consisting of 100% equity, you would have experienced a max drawdown of ~40% at one point (Around the 2008 crash). The fluctuations in the portfolio value are also captured by the low Sharpe Ratio of 0.62 which showcases that you are not adequately compensated for the risk that you are taking by holding 100% equity.
In most statistical tests, it is usually required to set a base rate - To see what is the “average” rate of success. The SPY’s rate of returns and risk is usually set as the benchmark because it accounts for the bulk of “safe returns”. Any returns outside this are usually accounted to an edge, the “alpha”, and finding that edge is what beating the market is all about.2
Balanced Portfolio
This is the type of investment strategy where you are taking a balanced approach to investment. Having a 50:50 split on stocks and bonds would definitely impact your overall returns, but you can sleep better knowing that even in the case of downturns, your portfolio is well protected.
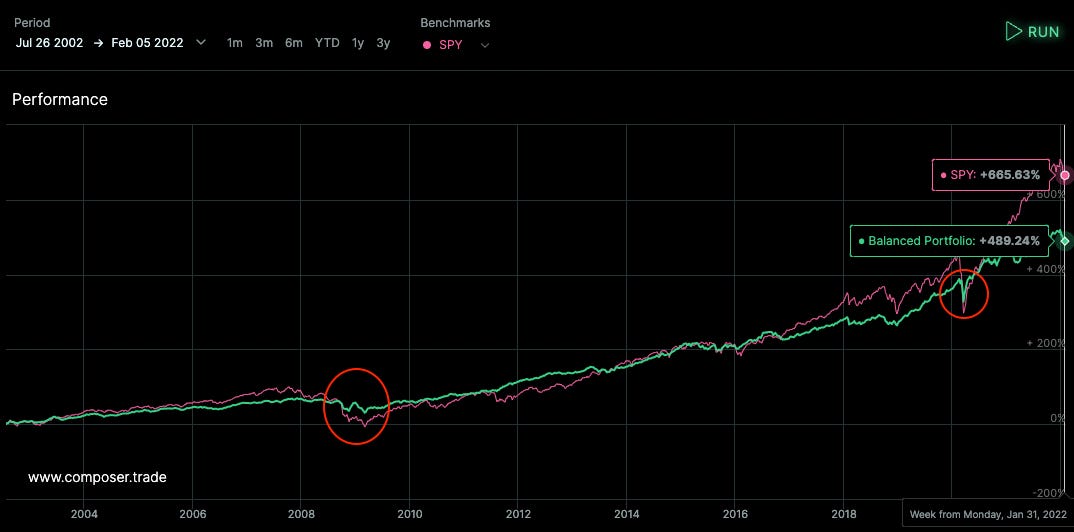
While the balanced portfolio did end up giving lower returns, it’s much better in terms of the max drawdown. Your portfolio would only have had a max drop of 14% when compared to the 40% drop experienced by SPY. Adding to this, the portfolio has an excellent Sharpe Ratio of 1.35 when compared to just 0.69 of SPY during the same period.
What’s even more interesting is that the portfolio ends up performing better than SPY during crashes3. As you can see from the backtest, during the financial and Covid’19 stock market crashes, your portfolio would have done much better than the market. The 2.5% CAGR4 you are sacrificing by not going 100% in SPY is rewarded in terms of a better portfolio during the tough times.
Harry Markowitz, the father of Modern Portfolio Theory, himself preferred the balanced strategy though his models indicated a more nuanced split. His reasoning was that it allowed him to sleep better at night.
Link to the balanced portfolio backtest5
Diversified Portfolio
In this type of investment, we are looking to get a piece of all types of companies. I have considered an equal split (33.33%) between Large-cap, Mid-cap, and Small-cap funds.
The proposed type of diversification lessens the portfolio risk (as can be seen from max drawdown) but at the same time ends up giving a slightly lower return than purely holding the S&P 500. If you consider the Sharpe Ratio, SPY performs slightly better as you would have had similar fluctuations holding a diversified portfolio while generating slightly lower returns.
I expected that the addition of Small and Mid-Cap should have generated better returns than SPY, but my hypothesis here is that the heavy concentration of tech stocks in SPY (~25% now) pushed the rate of return higher than that of the diversified portfolio containing small and mid-cap stocks given the recent performance of tech stocks. This brings us to the:
Tech Enthusiast
Another one of the common strategies that has paid out handsomely over the past few decades. In this, we are allocating 100% of our monthly investments towards Nasdaq-100 (QQQ).6
Well, would you look at that! Over the last 2 decades, QQQ has returned more than double the investment return of the S&P 500. This can be attributed predominantly to two reasons.
Tech stocks had an amazing run due to the advances in tech as well as the availability of cheap capital after the 2007 crisis.
Our starting point (2002) is heavily biased towards QQQ. It’s the lull after the 2000 dot com bubble. If we had started the same analysis in say 1990, we would have had a very different result (QQQ dropped 78% from its peak compared to only a 46% drop in SPY during the same period).
Having 100% of your investment in one sector that performed phenomenally is bound to give stunning portfolio returns. Hindsight 20/20!
Growth Seeker
Here we are only focused on growth. Our investments are towards companies that are fast-growing. Since we are taking a higher risk on these growth stocks, we expect a higher portfolio return over the long run which is exactly what happened over the last 2 decades.
But once again this can be closely associated with investing in QQQ. I had considered Vanguard Growth ETF as my growth fund and as of today, their top 5 holdings are Apple, Microsoft, Google, Amazon, and Tesla. We are in a very rare time period where the largest companies in the world are considered to be the ones that are growing above the market rate! Adding to this, going 100% on a growth fund gave us better risk-adjusted returns than just investing in the S&P 500.
Buying the Dip
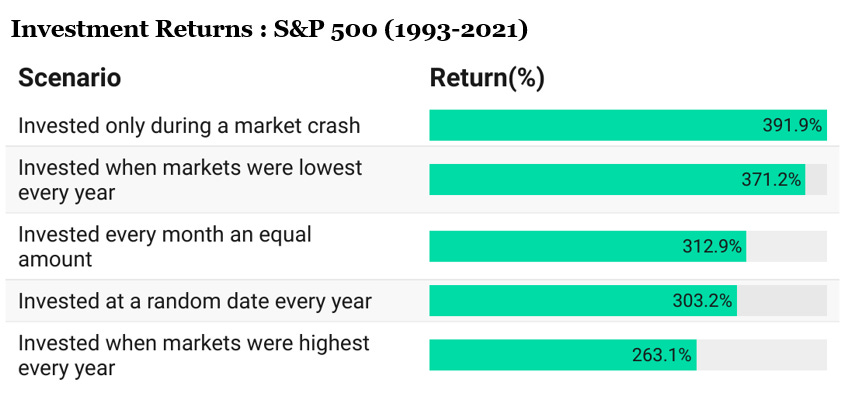
The idea here is simple. In this type of investing, you would not invest in the stock market and keep accumulating your cash position waiting for a crash. While this is a risky strategy, the returns do justify that investing during a crash tends to give you the best return.
I had already done an extensive analysis on Buying the dip that highlights the limitations as well as the nuances around buying the dip that is a must-read in case you are trying to replicate this strategy.
Dollar-Cost-Averaging of Crypto Markets
Finally, we couldn’t finish this without analyzing crypto investment strategies. I had created a Dollar-Cost-Averaging strategy for the crypto markets that we are going to leverage for this.
On the 1st of every month, you check what the top-10 traded currencies of the last month were (by volume) and invest in them. For example, if I am investing $100 on 1st Feb 2022, I will check what were the most traded (i.e popular) cryptos in the past month (in this case Jan'22) and then invest in that. By following this strategy, you are not jumping into any investment. You are just methodologically checking the popular cryptos at the beginning of the month and investing in them.7
The underlying principle was to create a straightforward strategy that can be followed by anyone without luck coming in as a factor. Now there would be two ways to invest in the top 10 currencies. You can either split your investment equally across the cryptocurrencies or split it in the proportion to the traded volume.
Both strategies give amazing returns but equally splitting your investment produces almost double the weighted average split. At the same time, you should be aware that the eye-popping returns do come at extreme risk of capital.
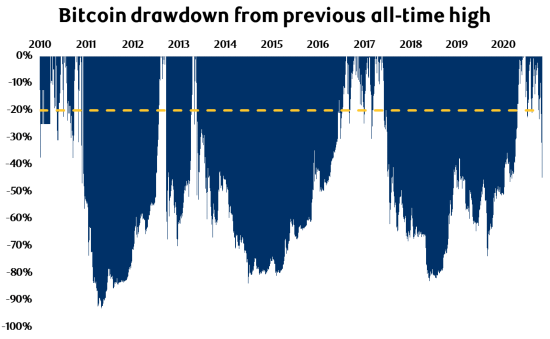
The Crypto world has experienced 80%+ drawdowns multiple times in the last decade with bitcoin losing more than 90% of its value in 2011. You have to remember that once an asset reduces 90% in its value, it has to come back up 900% just for you to break even!
Phew! That was a lot to digest for sure. As I said in the beginning, this was not about finding an investment strategy that generates the most amount of returns. This was more about finding a strategy that fits you.
Maybe you are still in the SPY and Chill bucket and want the simplicity associated with your portfolio. Or maybe you were swayed by the excellent drawdown protection of the balanced portfolio or the eye-popping returns generated by tech enthusiasts. Finally, you might want to dip your toes in the crypto market after seeing the 10,000%+ returns if you have an above-average tolerance for risk.
We have barely scratched the surface here and there are many more strategies out there that we haven’t covered that might be perfect for you. The idea here is that there are much better strategies (both in terms of risk-adjusted returns and max volatility) than just investing in the S&P 500. It’s up to you to find one that fits you the best!
In the immortal words of Morpheus,
Until next week…!
Data used in the analysis: Here
Lumpsum investment backtests : (SPY, Balanced, Diversified, Tech)
More interesting reads
How Much Land Does a Man Need? - This is a fantastic short story by Leo Tolstoy about a peasant named Pahom, who tries to acquire as much land as possible to find peace of mind. You can read the full story here or the TLDR version here.
The Happiness Curve: In this book, Jonathan Rauch describes how happiness in most people starts declining in the late twenties, bottoms at age fifty, and then increases after that. When plotted, lifetime happiness ends up looking like a U-curve (or a little smile). I do hope our portfolios do not end up looking like that.
For example, in case you are considering lump-sum investing, placing the starting point in the dot-com bubble (2000) would give vastly different results than if you consider your starting point as 2002. Case in point, CISCO stock still hasn’t breached its dot-com bubble value.
Though there are a few other factors now that are recognized as adding minor increases to the market returns - Such as value, growth, small-cap, etc.
Please note that this backtest is made using a lump-sum investment and not a monthly investment. It’s more for the purpose of an insight into how holding bonds can be beneficial in case of a crash.
While 2.5% CAGR does seem negligible, if you look at the cumulative returns, the 100% SPY portfolio gives 293% vs the balanced portfolio only returning 192%. That’s a difference of ~100% on your returns! Yeah, compounding is a b***h when it works against you.
Please note that this link is for lumpsum and not DCA.
I know that QQQ is not completely tech but when compared to the 23% allocation towards tech in S&P500, QQQ has more than 70%+ allocated to tech.
The returns here are calculated using an investment period between 2014 and 2021.
If you enjoyed this piece, please do us a HUGE favor by simply liking it and sharing it with one other person who you think would enjoy this article! Thank you.
Subscribe to Market Sentiment
Actionable, data-backed investment insights for long-term investors, financial advisors, and analysts.










Loved this article so much I turned it into a video. Thanks so much Market sentiment for the inspiration, as well as a very informative breakdown of some tried and true strategies out there.
Here's the video for anyone interested. https://www.youtube.com/watch?v=t6rdtrShpAc
Wonderful insights. As long as you consistently invest for a long period, your wealth will grow no matter which one you choose.