
Discover more from Market Sentiment
Hello friends! Welcome to Market Sentiment. Join 16,368 other smart investors and traders by subscribing here:
If you are new here, you can check out my best articles here and follow me on Twitter too!
Market Sentiment Survey
This is something that has been on my mind for a long time now. It would be super helpful for me to learn about who you are, what you’re looking to get out of Market Sentiment, and what we can do better.
It would also help me decide if it makes sense to create market-specific content, cover more geographies while creating strategies, and finally have meaningful partnerships with sponsors which can be a win-win situation where you can see relevant sponsors and I can keep this newsletter free forever.
Everybody has a plan until they get punched in the face - Mike Tyson
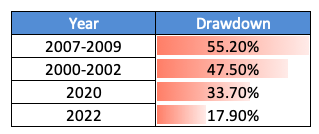
There’s no point beating about the bush here - From Twitter to the mainstream media, everyone’s talking about the market correction. The S&P 500 saw an 18% drawdown and Nasdaq is down 25% YTD, enough to get investors and traders panicking about the dream bull run ending, and wondering whether we’re entering a bear market now.
But when emotions are high and anecdotes are used to draw comparisons, there’s only one recourse - Data. We’ve seen three significant corrections over the last 20 years and studying the market’s behavior during those corrections can give us clues about what to do. Let’s dive deep into the previous corrections to understand why this isn’t the time to panic - And what you should do with your investments now.
Data
There were three major market corrections in the past - In 2000-02, in 2007-08, and in 2020. I mainly looked at data related to these periods to answer two questions:
Should you wait, keep investing, or double down during a dip?
Can you protect against downside risk?
I have used the S&P 500 as the benchmark for most of these backtests. The data for this article has been collected using Yahoo Finance. The analysis and data are shared at the end of the article.
Buying the dip
Markets fluctuate every day. But the reason a drawdown gets everyone’s attention is that the drop in prices is rapid, and the psychological effect is immense. The 2007-08 correction saw the S&P 500 losing value by more than 50%. Imagine seeing half the value of your portfolio seemingly evaporate overnight!
It’s very hard to hold on to your investments in such cases. The instinct is to sell at a high and buy at a low. But is it possible to do so reliably? Market timing is a tricky business and it does not work in the long run.1 But in the case of a market correction, should you wait out the storm before investing again, or should you double down and buy more? Let’s study the past corrections to find out.
Consider three investors: Cautious Charlie, Average Andy, and Daring Dave. Each of them invests $100 into the S&P 500 at the beginning of every month. When the market goes below 10% of the previous all-time high (let’s call this the threshold), each investor reacts differently to the dip.
Cautious Charlie “holds” - He stops investing and waits till the market crosses the threshold again.
Average Andy “stays” - He continues investing as usual.
Daring Dave “doubles” - He invests double the usual amount till the market crosses the threshold again.
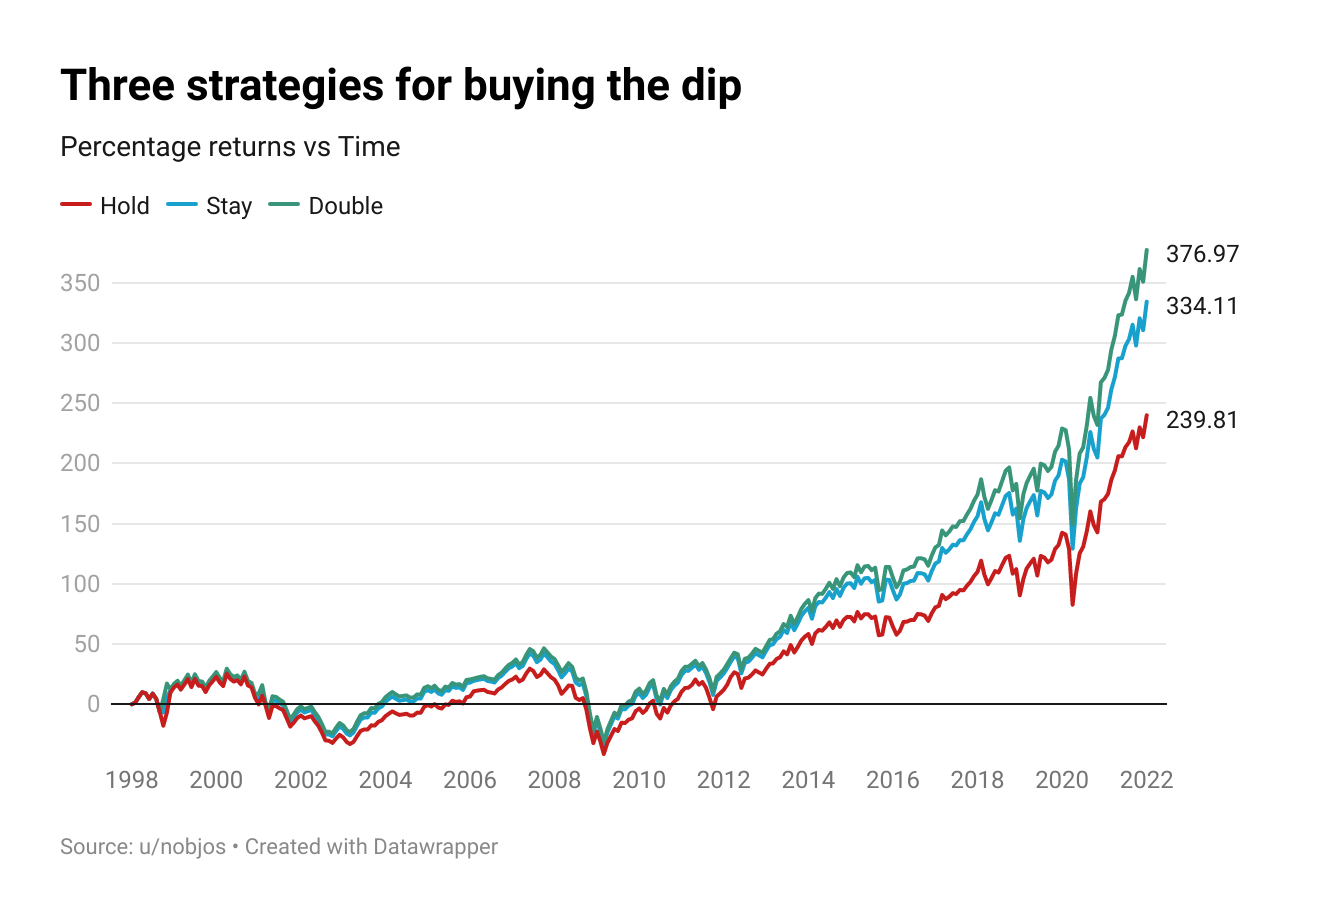
Who did better? Here’s how they would have performed if they had started investing in 1998:
Would you look at that! At the end of 24 years, Average Andy and Daring Dave have returns of greater than 330% while Cautious Charlie has a return of about 240%. The most profitable strategy is to double down during dips, but continuing to invest as usual also does great.
But how do their average returns compare in the short term? These are the average returns if you had invested using the three strategies starting at the beginning of the last three major corrections:
Even in the short term, buying during the dip is far superior to waiting.2 You would have lost money by waiting but made positive returns over even a 3-year and 5-year period if you had continued to invest - and the profits of the “double” strategy are almost 2x that of the “hold” strategy where you stop investing.
The message is clear - Buy the dip if you can afford to.
Hedging your bets
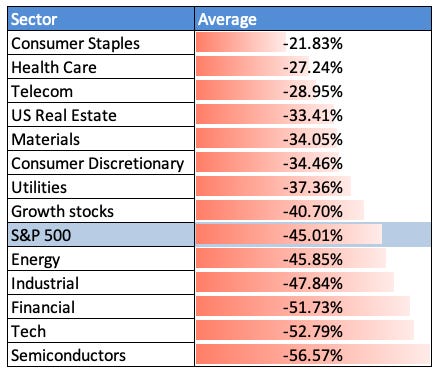
Sometimes we get so lost in the commotion that we forget to analyze the fundamental reasons behind a correction. A blanket term like a market correction is hard to understand - but looking at how different sectors performed during similar periods in the past can help us find safe bets. This is how each sector performed on average:
During the last three major drawdowns, semiconductors, tech, and financial stocks were the worst affected. On the other hand, consumer staples, healthcare, and telecom have seen a drawdown much below what the market sees on average. This offers an opportunity - while continuing to invest in the S&P500 is a good strategy, ETFs which invest specifically in these sectors can offer some protection against the downside (The risk of course is that you will miss out on the opportunities that Tech and Growth stocks provide).3
How you see the market also depends on how you look at it. The S&P500 is just one index out there, and other indices tell a different story. The NASDAQ 100 is a tech-heavy market-cap-weighted index that does not track financial companies. The Russell 2000 tracks 2000 small-cap stocks. The Dow Jones Index is a price-weighted index (unlike the others) that tracks only 30 companies - and it leaves out a lot of big Tech names like Alphabet, Meta, and Tesla.
Historically, the Nasdaq and Russell 2000 have reacted much more violently to a market correction than the Dow Jones, as the Nasdaq invests heavily in Tech, and the small-cap companies in the Russell 2000 are more susceptible to corrections. Currently, the market might be in the middle of a correction and we don’t know when it will end - but this is another indicator that investing in non-tech stocks like the Dow Jones Index does is a good way to hedge your bets.
Should you wait?
Be fearful when others are greedy. Be greedy when others are fearful.
- Warren Buffett
We saw earlier that timing the market is a very unreliable strategy. To push this point further, here’s a thought experiment: How long did it take for the price to double from the high before the correction, compared to the time taken to double from the market low?
The market took 1-2 years to hit the bottom but recovered in 2.6 years on average. But what’s more interesting is the time taken for the price to double. It took 16 years for the S&P 500 to double its price before the 2000 correction, and it took 10 years in the case of the 2007 correction. It hasn’t doubled yet after the 2020 correction. But it took only 2.9 years on average for the market to double from its lowest point. This is another reason to continue investing during crashes - Otherwise, you will miss the party train on the way up!
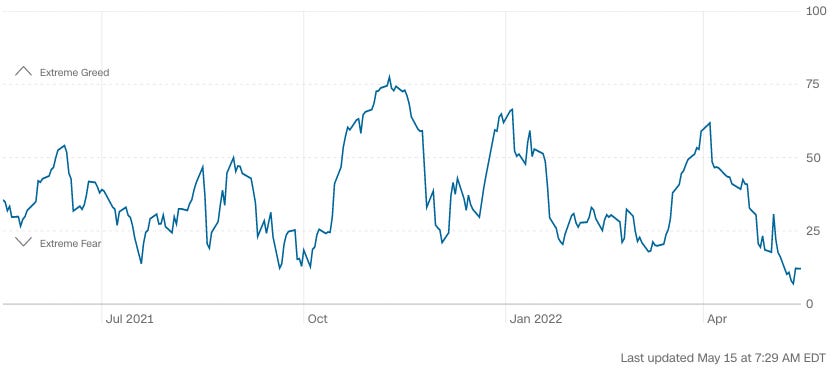
In fact, if you believe that compounding is the key to long-term wealth creation, unnecessarily disturbing your portfolio could cause more harm than good. CNN tracks market sentiment through a metric called “The Fear and Greed Index”. Right now, the index is at an all-time low - indicating that the market is very fearful and it’s a good time to buy.

Conclusion
Market corrections are psychologically difficult times, and all investing rules go out of the window. It’s hard to hold on to your stocks when you see them go down, but as the data shows, market corrections of more than 10% are not a time to sell, and rather a time to keep investing or even invest more.
Be clear about the timelines of your investing. Hedge your bets to reduce risk if necessary but consider if it’s worth interrupting your investment if you don’t need the money now. If your wealth-building game is long-term and not based on trading, there is little reason to try and time the market. Stay invested, wait for the recovery, and be greedy when others are fearful.
Data: All the data used in the analysis can be found here
Clarification: In an earlier version of the article, I had published in the section “Should you wait?” that the market took 6 months to double from its previous high on its way up, and it took 6.72 years on average for the market to double from its price before the crash. This observation was incorrect and has been corrected. Thanks to our reader Tan Peng Yu for pointing it out.
Disclaimer: I am not a financial advisor. Please do your own research before investing.
As Nick Maggiuli demonstrates in this article, rules of thumb like “wait for six months before buying into the market” would have given you a profit after the 2000 and 2007 corrections, but you would have miserably underperformed in the 2010s when the volatility was not as much.
The 2020 correction was excluded from 3 year and 5 year returns.
There’s a parallel between the 2000 Dot-com bubble and the correction that’s happening now, in that Tech and growth stocks are the worst affected even now. But this is not the burst of a bubble unlike 2000 when Amazon was just 6 years old and Facebook didn’t even exist. What’s going on? One explanation for the current dip is that the free money that was pumped into the system after the COVID lockdown last year propped up the market to unrealistic levels and now that the Fed rates are kicking in, the market will normalize at a little higher than pre-pandemic levels (Michael Batnick covers this in his excellent article).
If you enjoyed this piece, please do us the huge favor of simply liking and sharing it with one other person who you think would enjoy this article! Thank you.
Subscribe to Market Sentiment
Actionable, data-backed investment insights for long-term investors, financial advisors, and analysts.


Have a simple rule: If it's more than three then go on a spree.
If on any trading day S&P500 is -ve >3% then buy the index etf. Have done a rudimentary back test during bear markets of 2000, 2008 and 2020..seems to work..
Great research, I love how you highlight the power of dollar cost averaging & how difficult it is to actually time the markets.