But can past performance predict future outperformance?
Here's what happens if you invest in the top 10% mutual funds based on their past year's performance:
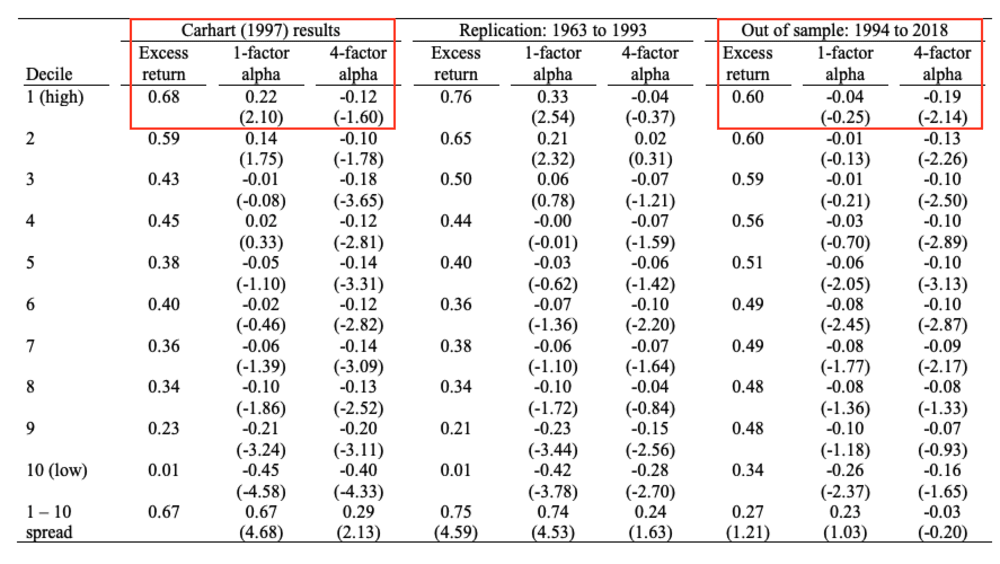
Mark Carhart published his seminal study on this in '971 and found that past-year performance positively predicted the U.S. equity mutual fund's future performance. The top 10% of the funds from the previous year outperformed the bottom 10% by 0.67% per month! (1963 - 1993).
Carhart attributed this alpha predominantly to individual stock momentum. Momentum investing is well-proven, and funds with outperformance tend to hold high-momentum stocks. Fund managers rarely sell their winners, and the momentum effect carries over to the following year.
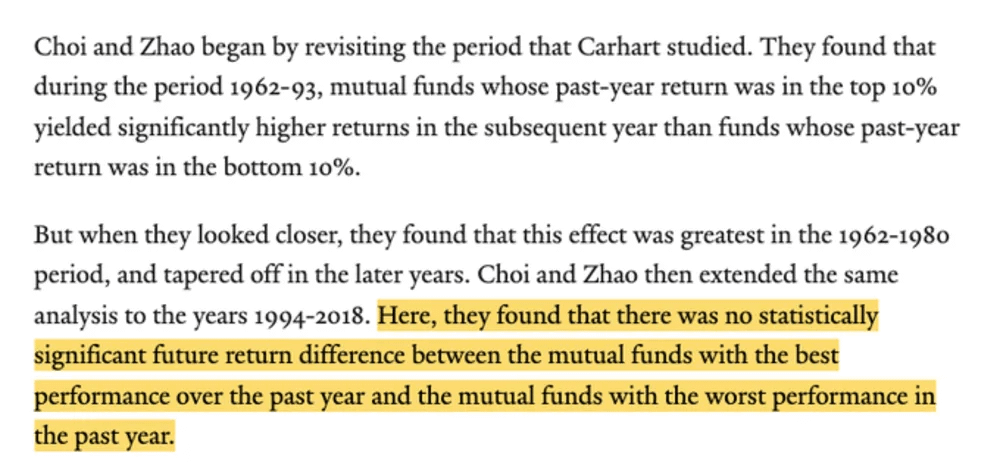
But, as you would have already noticed, this study was done more than 25 years ago. So, does this trend still hold? - unfortunately, no. Recent research from Yale University2 shows that from 1994 to 2018, the best-performing mutual funds did not produce any alpha.
They replicated the research done by Carhart and expanded it till 2018. While the outperformance was present from 1962-93, there was no statistically significant return difference between mutual funds from 1994. You will do worse if you chase past returns.
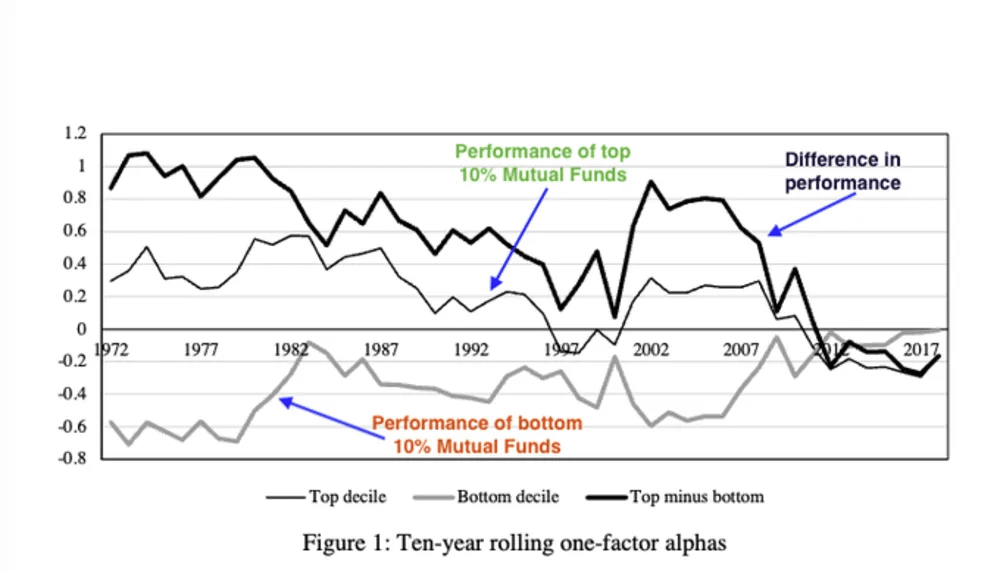
As for the returns, the difference in the 10-year rolling alpha of the top and bottom 10% mutual funds has declined over time, and after 2012, the bottom decile funds are performing marginally better.
Data, References, and Footnotes
On Persistence in Mutual Fund Performance — Mark M. Carhart (open access)
Did Mutual Fund Return Persistence Persist? — James J. Choi & Kevin Zhao (open access)
Thank you for reading. Market Sentiment is now fully reader-supported. A lot of work goes into these articles, and if you enjoyed this piece, please hit the like button and consider upgrading your subscription to access all issues. (20% off for annual subscription)
SPACs are considered a cheaper and faster way to go public than IPOs, but, SPAC's costs are significantly higher when you dig into it.
How high?
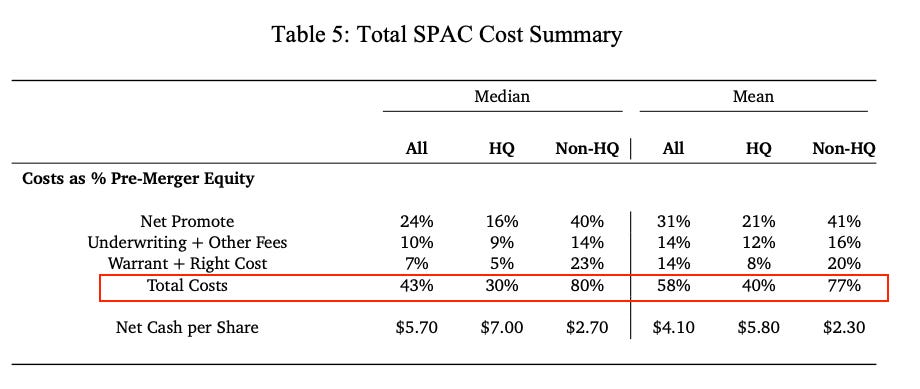
Stanford and New York University researchers1 found that, on average, 58% of pre-merger equity went into servicing the SPAC. i.e., for every $10 raised by a SPAC, only $4.2 is left to contribute to the target company for acquisition. And here's the kicker -- most of these costs are not borne by the companies but by SPAC shareholders who hold shares at the time of the merger.
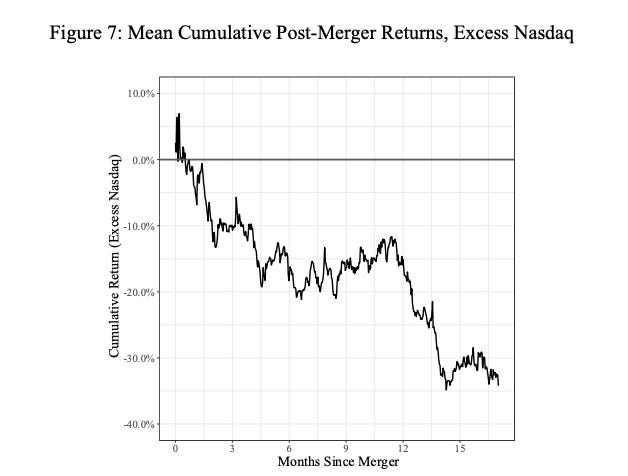
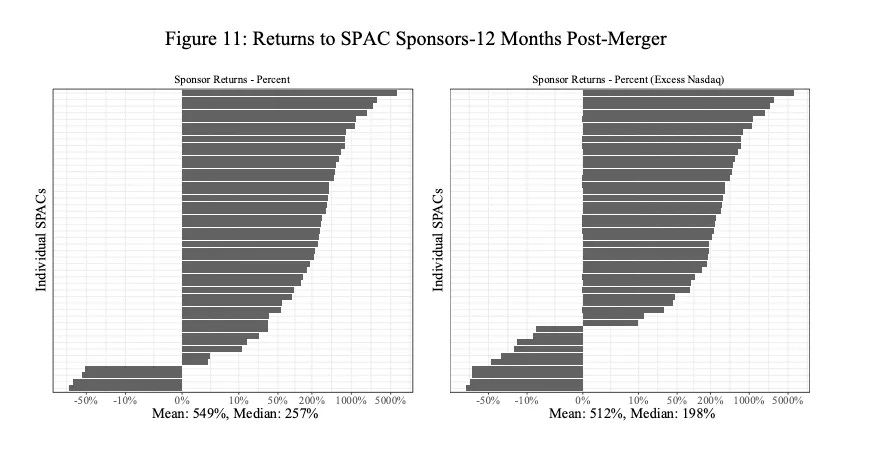
SPACs also create dysfunctional incentives for the sponsors. Sponsors do very well, even if the SPAC investors do poorly. Even among the SPACs that underperformed Nasdaq by at least 30%, sponsors made, on average, a cool $5 million in profits (187% excess return).
The SPAC structure is simple. It's formed by a sponsor (e.g., Chamath) who engages an underwriter to issue shares to investors in an IPO. SPACs generally raise $10 per share from investors in the IPO and have 2 years to find a target company to merge with (e.g., Virgin Galactic).
If a SPAC cannot find a target within two years, it must liquidate and return all funds to investors with interest. SPACs are usually considered safe as investors have the option to redeem their shares rather than participate in the merger.
While this looks good on paper, most investors overlook the hidden costs and the misaligned incentives between sponsors and investors.
First, the sponsor takes ~20% of the SPAC's post-IPO shares for a nominal price in exchange for establishing and managing the SPAC. Next, the underwriter receives ~5% of the IPO proceeds as fees. (e.g., Credit Suisse made $771 million in revenue in 2021 from SPACs and IPOs). This in combination with accounting, legal, and financial advisory fees can push the overall fee to ~14% of the proceeds.
Finally, on average, the free warrants and rights issued to the IPO investors cost another 14% as this comes at the expense of either the SPAC shareholders who remain invested in the merger or the target company.
Another important metric is the quality of sponsors.
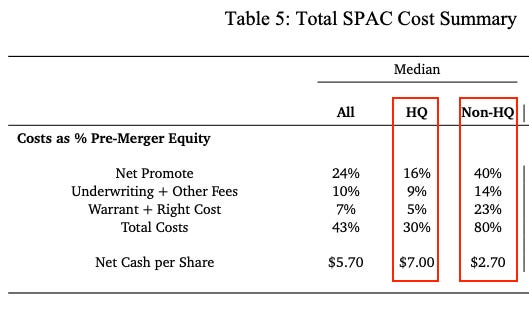
The overall costs incurred are significantly different based on whether the sponsors have an AUM of > $1B or if they have former senior officers of Fortune 500 companies. (Researchers classified them as High quality - HQ)
There's only one way the SPAC and target company shareholders can come out ahead on the deal: If the proposed merger can produce enough value to cover the above costs.
This does not happen for most SPACs.
The target companies know the costs and negotiate a merger agreement where the shares they give up are only worth the net cash, not the $10 per share as investors think. So, the SPAC shareholders who do not redeem bear the costs after the initial hype is over.
The biggest structural flaw of SPACs is that sponsors get rewarded only if they complete a merger. If they merge, they get millions of dollars (even if it's a value-destroying merger); if they don't, they get nothing and lose all their investment.
See the conflict of interest?
Research backs this up. The sponsors do very well even if the SPAC investors do quite poorly. Even among the SPACs that underperformed Nasdaq by at least 30%, sponsors made $5 million in profits (187% excess return), on average.
While we don't want to single anyone out, a classic real-life example of this would be “SPAC King” Chamath Palihapitiya. His company made $750 million through SPACs, roughly doubling its money. Compare this to the actual stock performance, and you start to see the issue.
It's not that all SPACs are bad or that sponsors always lead shareholders into bad deals on purpose. The current incentive structure forces their hand into making a deal and the "ex-post experience is consistent with their ex-ante incentives."
Show me the incentive and I'll show you the outcome. — Charlie Munger
Market Sentiment is now fully reader-supported. A lot of work goes into these articles and if you enjoyed this piece, please hit the like button and consider upgrading your subscription to access all issues. (20% off for annual subscription)
Michael Klausner, Michael Ohlrogge, Emily Ruan — Full paper (open access)
The talk of recession has been in the air for a while, and it’s looming over the economy like a boogeyman. In spite of all the talk, clarity is lacking on what a recession means for the economy. How can it affect the stock market and your portfolio? Let’s take a quick look at how a recession happens and what’s happened to the market in past recessions to answer this.
What is a recession?
The National Bureau of Economic Research (NBER) has defined a recession as “a significant decline in economic activity spread across the economy, lasting more than a few months, normally visible in real GDP, real income, employment, industrial production, and wholesale-retail sales.”1
A recession, unlike a temporary decline or disruption in economic activity, is more long-lasting and has implications for the entire economy. Some of the probable causes of a recession are:
Sudden economic shock - Like the OPEC oil supply cut-off in 1970 or the COVID crisis in 2020, an unexpected rupture in the economic cycle can trigger a recession.
Excessive debt - The housing bubble in 2007 is a prime example of this. The availability of cheap credit turned into a nationwide disaster when speculation on housing prices led to thousands of people defaulting on debt - and shaking the economy which was built on this debt.
Asset bubbles - The Dot-Com bubble in 2000 was a time when the mere status of being in the “Internet” business would make investors line up to invest. This led to a massive bubble that popped and created a recession.
Inflation - When inflation is rampant, the Fed steps in and increases rates (like it did in 1970), prioritizing the stabilization of unemployment and other metrics over economic growth. This leads to a recession.
Deflation or Technological change - A lack of demand for goods and services being produced, or increasing unemployment due to automation of jobs could lead to demand-side issues and lead to a recession. The deflation scenario was seen in Japan.
So which of these can we tick off now? The economy is still recovering from the disruption of the pandemic but the war has brought in a whole new set of shocks. Inflation is the highest it’s been in more than 40 years, and with the Crypto market gaining traction, asset bubbles are now easier than ever to manufacture. Three out of five causes - sounds like a reason for worry. If a recession does occur, what are the implications?
How long do recessions last?
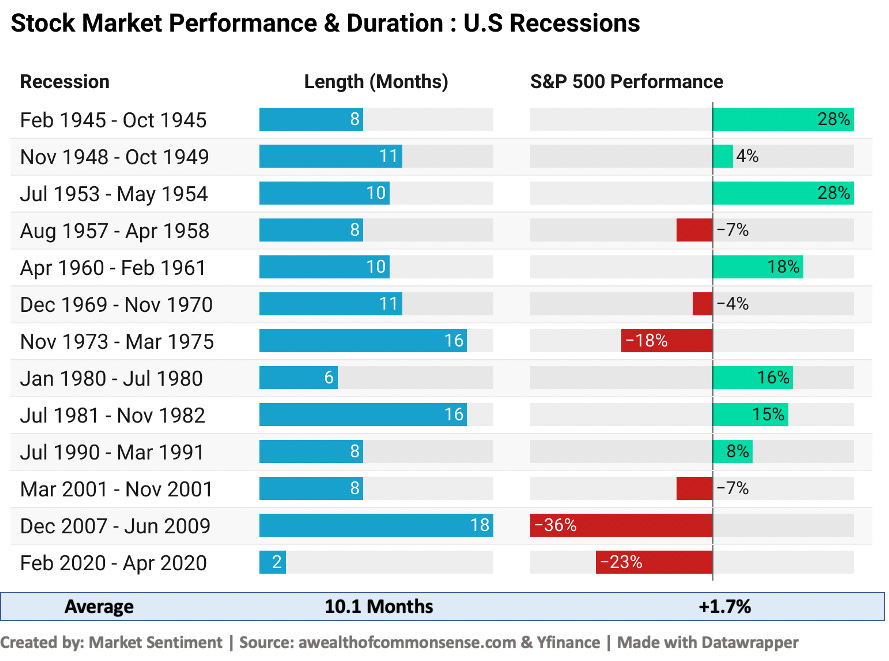
Though recessions have a scary reputation, since 1945, recessions have lasted an average of 11 months with a 2.3% average decline in GDP. No recession has lasted more than 18 months in the past 70 years. The reason that a recession might seem scary now is also because of the recency bias where we tend to remember things that happened in the recent past more vividly - The longest recession after WW2 was the 2007 financial crisis, and that has overpowered the other data.
Let’s take a look at all the recessions after WW2. Ben Carlson from “A Wealth of Commonsense” has written a couple of articles that dive much deeper into these questions, and I’m leveraging that data for this analysis.
As can be seen, in the past 13 years, recessions caused the market to lose value only half of the time, and on average you would still have come out ahead, with an overall return of 1.7%. This means that recession or not, investing in the stock market was still one of the best bets available.
But hindsight 20/20 - Just because the average performance during a recession was positive, doesn’t mean that the market didn’t go through a brutal drawdown that would have played havoc on emotions. As you can see below, on average, the S&P 500 had close to 30% drawdowns during these recessions.
The maximum drawdown was in 2007-09 with a drawdown of 57%. Imagine seeing more than half of your portfolio lose value! Even those with nerves of steel would find it hard to not panic sell. But say you did hold on. Then what?
After the recession
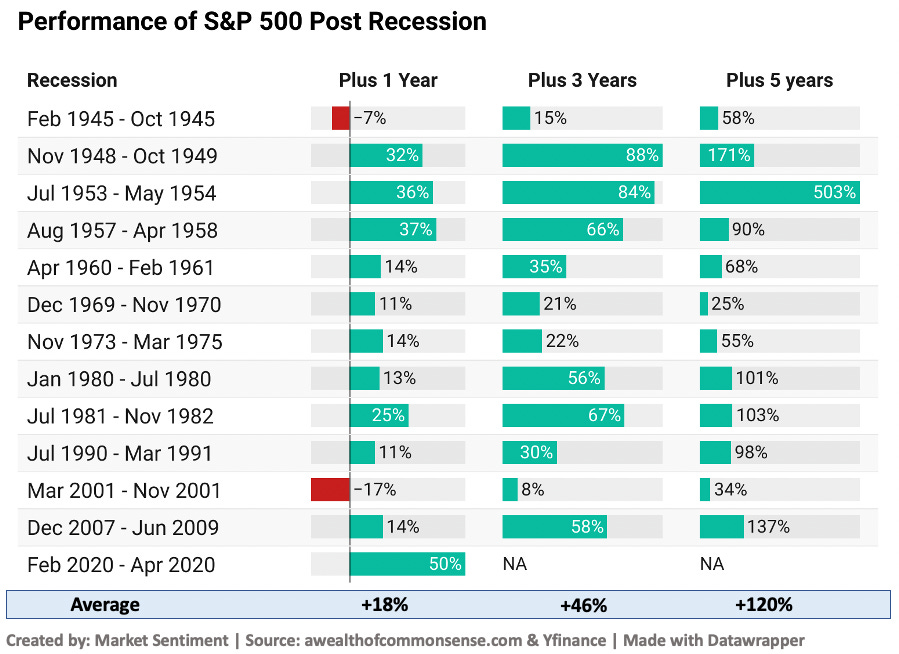
This is the most striking insight. After the end of the recession, in just one year, you would have made money in 85% of the cases. And after 3 years, you would have been in the green in 100% of the cases!
The rationale behind this is simple - The recession is a time of little hope and bleak prospects, but as investors start hearing news of the economy reopening and businesses growing once more, the optimism alone is sufficient to drive the market upwards. The economy can remain sluggish in the aftermath of a recession but the stock market may still be rocketing higher in anticipation of relative improvements.
Since there is no clear indication about how long a recession would last and when a recession is fully over, timing the market would be futile. But buying and holding would have reaped great returns.
This shows the importance of staying invested. If you are still feeling adventurous…
Can you predict a recession?
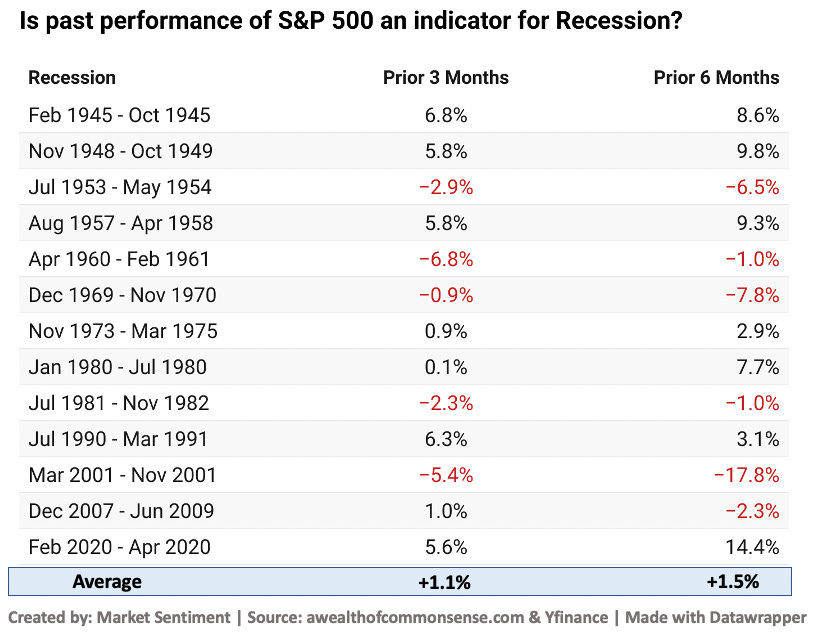
If the market has such a close connection with the recession, it might seem like there’s a link between market performance and a future recession. But the reality is that past market performance is a terrible indicator when it comes to predicting a recession.
Take a look at the stats below. Looking at the market returns in the prior 3 and 6 months, it was as likely that the market was positive as it was negative. Also, on average, both 3 months and 6 months’ performance was positive. There wasn’t any way to predict a recession looking at market performance alone.
Conclusion
It looks like recessions are hard to predict looking at market returns. The volatility of the market is also stressful to stay calm through. But the message is clear looking at past data.
Staying invested in the market regardless of economic conditions gives the best returns, not just over the long term, but in as little time as 3 years. Also, seeing that recessions last anywhere from 12-18 months, it might be a good idea to build an emergency fund that lets you weather over the period without disturbing your investment goals.
See you next time with another quick read!
This is a quick read. I write more in-depth articles like my strategy for consistent returns from the crypto market and investing strategies for every risk level on my weekly newsletter Market Sentiment. You can subscribe here:
Disclaimer: I am not a financial advisor. Do not consider this as financial advice.
If you enjoyed this piece, please do us the HUGE favor of simply liking and sharing it with one other person who you think would enjoy this article! Thank you.
A list of recessions with start and end dates can be found here.
